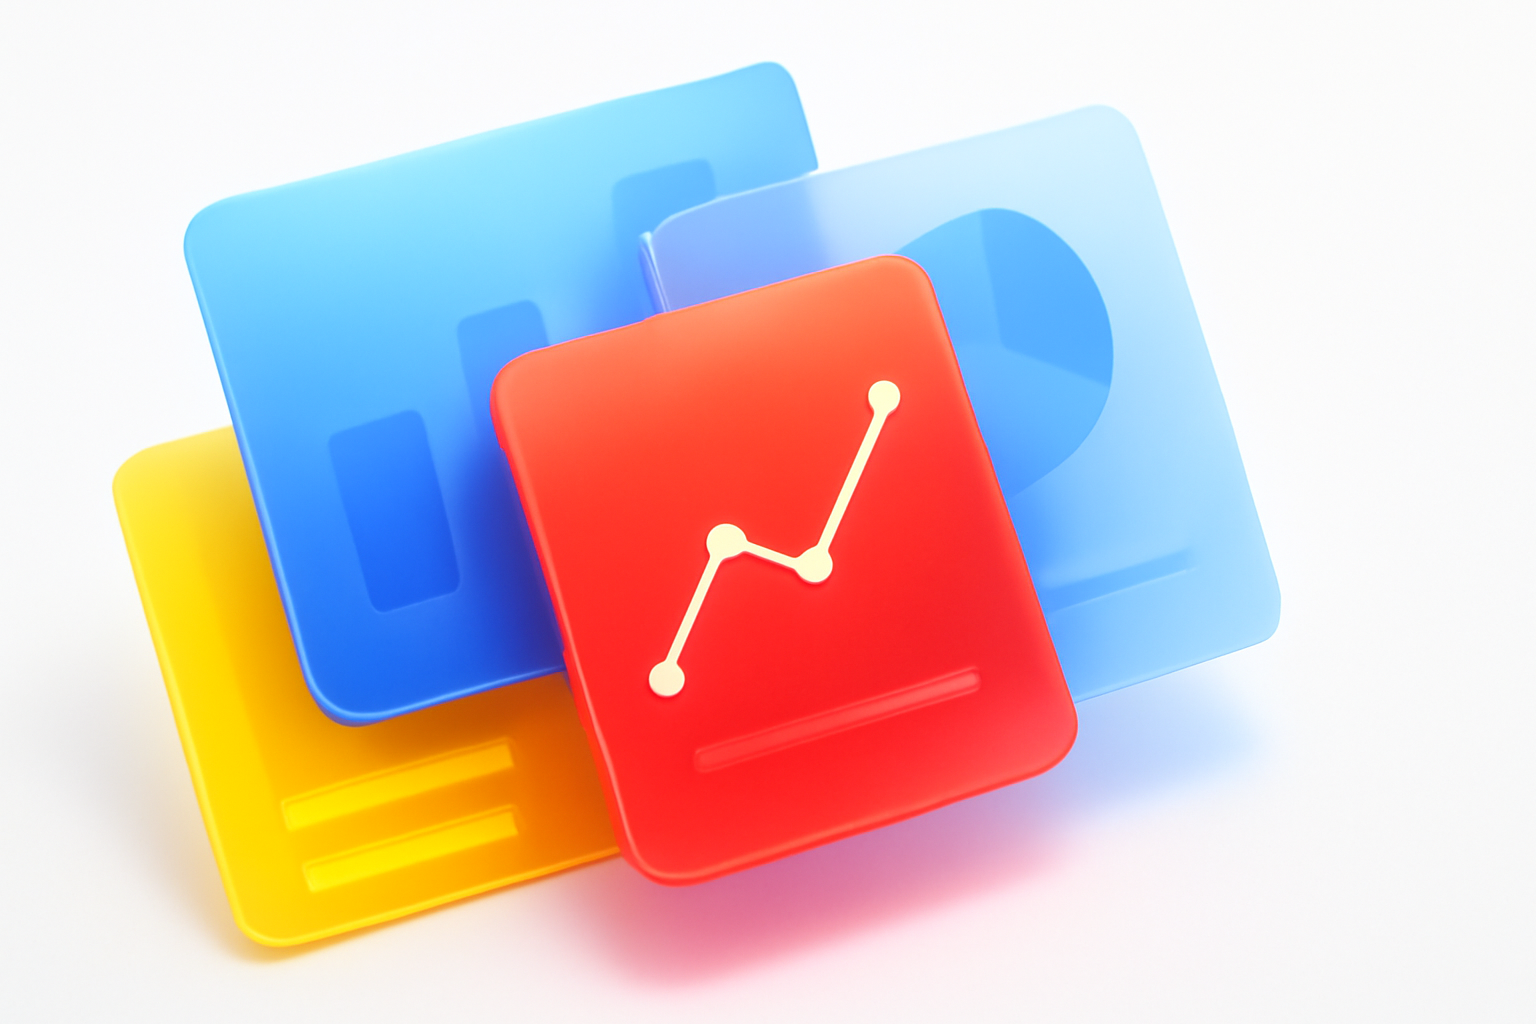
Optimizing Performance Analysis via the New Merchant Experience Dashboard
How the shift to 180-day metrics and the 'Promote' tab reshapes reporting for local businesses.
Google has significantly updated how merchants interact with their data, moving essential reporting tools into the New Merchant Experience (NMX) surface. Last updated May 6, 2024, the platform now provides a broader window for interpreting Google Business Profile performance metrics, extending the visible data range and altering the navigational path for managers.
Historically, business owners were limited to a rolling 90-day window for analyzing customer interactions. The transition to a 180-day period within the direct-edit interface offers a more substantial dataset for identifying seasonal trends and long-term growth. For an operator such as a multi-location dental practice in Leeds, this change allows for a side-by-side comparison of semi-annual performance that was previously disjointed or required external spreadsheet tracking.
Why is the 180-day window essential for performance reporting?
The expansion to six months of data marks a departure from the short-term focus of the previous dashboard. While the legacy interface often felt like a snapshot of the immediate past, the current reporting structure encourages a broader view of the customer journey. For example, a 12-location HVAC operator can now compare the start of the cooling season in April directly against the peak heating demand in October within a single view.
This extended visibility helps mitigate the impact of anomalies. A single week of extreme weather or a brief technical glitch with a website link can skew a 90-day chart significantly. By doubling the available timeframe, we find that the data provides a more stabilized view of how a business is performing against its local competitors.
Navigating the Promote tab for reporting metrics
Accessing these insights requires a shift in workflow. Rather than navigating through a dedicated 'Insights' tab in a separate dashboard, managers now find these tools through a branded search of their own business. As noted by Colan Nielsen at LocalU, the 'Promote' button has become the primary gateway to these metrics.
Once inside the 'Promote' section, users can select 'Performance' to view graphed data. This menu also houses options for managed posts and advertisements, centralizing the tools used to drive engagement. We observe that this integration signifies Google's intent to pair performance data closely with the actions (like posting or advertising) that influence those numbers.
Long-tail strategies for Google Business Profile performance metrics
For agencies managing dozens of accounts, the direct-edit experience necessitates a change in reporting cadences. When data was limited to three months, monthly reports often lacked the context of year-over-year shifts. Now, the inclusion of year-over-year (YoY) comparison lines directly on the performance graphs allows for immediate context regarding whether a dip in calls is a local trend or a recurring seasonal pattern.
This data visibility is particularly useful for businesses with long sales cycles. A landscaping company may see high search volume in February that doesn't convert to 'Request a Quote' clicks until April. With the 180-day view, the correlation between early-season visibility and late-spring conversions becomes much clearer than it was under the older, more restrictive reporting windows.
What this means for local businesses
The move away from the legacy dashboard to the NMX direct-edit interface requires immediate adjustments to how teams collect and interpret data. We recommend the following actions for operators and agencies:
- Update Internal Documentation: Ensure that team members know to navigate through the 'Promote' tab rather than searching for the legacy 'Insights' sidebar.
- Shift to Quarterly Deep Dives: With six months of data now readily available, businesses should move beyond monthly check-ins and perform deeper quarterly reviews to identify multi-month trends.
- Utilize YoY Comparisons: Use the built-in year-over-year overlay to determine if performance changes are tied to internal optimizations or external market seasonality.
- Audit Data Access: Since the new experience relies on direct search results, ensure all relevant team members have the correct 'Manager' or 'Owner' permissions to see the edit overlay on Google Search.
Frequently asked questions
- Where can I find my performance data in the new dashboard?
- To find your metrics, search for your business name on Google while logged into the account that manages the profile. You will see a management menu above the search results. Click on the 'Promote' button, then select 'Performance' to view your interaction data, including calls, messages, and website clicks over the last six months.
- How long is data stored in the Google Business Profile performance metrics section?
- The current interface allows users to view up to 180 days (six months) of performance data. This is an increase from the previous 90-day limit. Additionally, the dashboard now includes year-over-year comparison lines, which allow you to compare your current six-month performance against the same period from the previous year.
- Does everyone have access to the new performance metrics layout?
- Google rolls out these interface changes in phases. While most businesses now have access to the New Merchant Experience (NMX), some accounts or specific categories may see variations in how the 'Promote' and 'Performance' tabs are staged. If you do not see the edit menu, ensure you are logged into the correct Gmail account associated with that specific business profile.
Related reading